

Is 25 g of protein always 25 g of protein? PDCAAS, DIAAS and nitrogen spiking
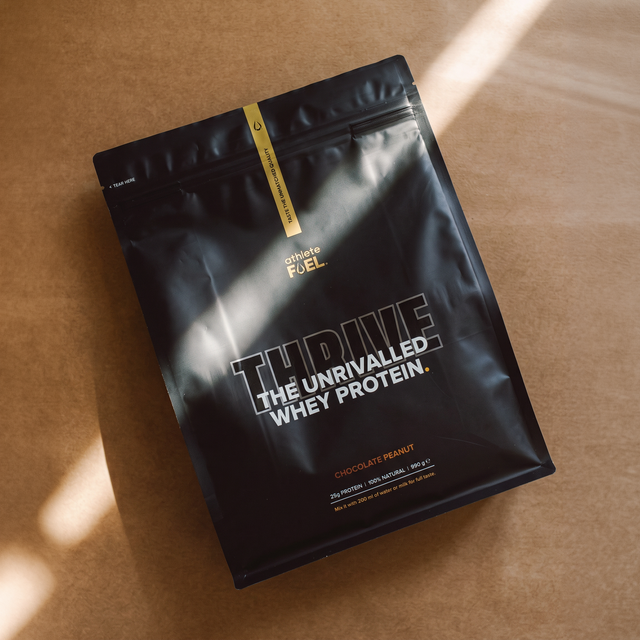
Under one of our THRIVE ads, a commenter summed up what many people quietly think: “25gr of proteins are 25gr of proteins.”
It is a fair challenge. If two tubs print the same number, why should one cost more? We answered briefly in the comments, but the question deserves a proper reply.
No, 25 g of protein is not always the same 25 g of protein. The figure on an EU label is calculated from nitrogen, so the test cannot tell protein from other nitrogen-containing compounds. It also says nothing about whether the essential amino acids match what your body needs. PDCAAS and DIAAS were built to answer that second question, but they only help when they describe the product in your hands. [1–4]
In our previous article, we looked at whether collagen lives up to its claims. This article goes one level deeper: how the protein number is produced, how it can be inflated, and how to read the two scores that sit behind it.
WHAT A PROTEIN TEST ACTUALLY MEASURES
Most people assume a laboratory measures protein. In standard testing, it measures nitrogen.
EU labelling law defines protein with a formula: total Kjeldahl nitrogen multiplied by 6.25. [1] The factor assumes that protein is 16% nitrogen, a convention dating back to the 19th century. [2] The other common method, Dumas combustion, also measures total nitrogen. [8]
This shortcut works reasonably well when almost all the nitrogen in a food comes from typical protein. It has two weak points.
First, proteins do not all contain the same amount of nitrogen. Collagen, for example, is about 18% nitrogen rather than 16%. [2] Second, food also contains nitrogen that does not belong to protein at all. [2]
A 2008 review put it plainly: when 6.25 is applied to everything, “protein” is simply nitrogen expressed in a different unit. [2]
The figure on the label is best understood as crude protein: an estimate built on nitrogen, not a direct count of intact protein.
This is not only a problem for other brands. In September 2026, Germany’s Max Rubner Institute and its partners published a database of food-specific factors. It gives milk and dairy a factor of 5.86, which puts cow’s milk 5% to 7% below its 6.25 figure. EU rules still specify 6.25, so labels are unchanged, including ours. [6]
NITROGEN SPIKING: HOW THE NUMBER GETS INFLATED
Nitrogen spiking, also called amino spiking, means adding nitrogen-containing ingredients that raise a powder’s result on a nitrogen test without adding the equivalent intact protein. [7,8] The test counts every nitrogen atom in the sample, so one gram of nitrogen from a free amino acid produces the same result as one gram of nitrogen from whey. [8]
Some ingredients are particularly efficient at this. The table below shows how much apparent protein one gram of each ingredient would add under the N × 6.25 formula.
|
Ingredient (1 g) |
Nitrogen content |
Apparent protein at N × 6.25 |
Is it intact protein? |
|---|---|---|---|
|
L-arginine |
32.2% |
2.01 g |
No, free amino acid |
|
Creatine monohydrate |
28.2% |
1.76 g |
No, not a protein amino acid |
|
Glycine |
18.7% |
1.17 g |
No, free amino acid |
|
L-alanine |
15.7% |
0.98 g |
No, free amino acid |
|
Typical dairy protein |
about 15.7% |
about 0.98 g |
Yes |
|
Taurine |
11.2% |
0.70 g |
No, not a protein amino acid |
Nitrogen values for the added ingredients are our calculations from their molecular formulas. The dairy row uses the traditional milk factor of 6.38. [2]
Read the creatine row again. A 3 g dose of creatine monohydrate would register as about 5.3 g of protein, without adding a single gram of protein.
Taurine looks weak by comparison, but it still registers as protein that is not there. Glycine and taurine have been reported as the most common free amino acids found in testing, and both cost less than whole protein. [7]
NOT EVERY ADDED INGREDIENT IS A SPIKE
Creatine can be a deliberate and useful addition to a formula, and glycine is sometimes added for texture and taste. [7] The ingredient is not the issue. The issue is whether its nitrogen is being presented to you as protein.
This matters because the ingredients most often used are not substitutes for intact protein. Taurine and creatine are not protein building blocks. Non-essential amino acids add little to the muscle-building signal: in a study of older adults, 18 g of essential amino acids stimulated muscle protein synthesis just as well as the same 18 g with 22 g of non-essential amino acids added. [3,10]
We sell creatine ourselves, in BUILD and FORGE. It is an excellent supplement. It should be sold as creatine, not as protein.
HOW COMMON IS IT?
In the United States, spiking allegations have led to a series of class action lawsuits. [7] We could not find a reliable figure for how common the practice is in Europe, so we will not claim that most brands do it.
It is also possible for a spike to arrive without a brand intending it, because a contract manufacturer or raw material supplier can introduce it further up the chain. [7] Standard nitrogen results on a certificate of analysis would not reveal this. [8]
COLLAGEN: A REAL PROTEIN WITH A FLATTERING NUMBER
Collagen needs to be treated separately. It is a genuine protein, so adding it is not spiking in the strict sense. It does, however, receive two advantages on a label that it has not fully earned.
The first is nitrogen density. At about 18% nitrogen, every gram of collagen reads as roughly 1.13 g of protein under the 6.25 factor. [2] So 10 g of collagen in a blend would read as about 11.3 g.
The most striking illustration comes from University of Illinois research. Bovine collagen analysed at 106.55% crude protein on a dry matter basis, while its measured amino acids totalled 93.33%. [5] Nothing can be more than 100% protein. That number is what happens when a nitrogen-rich protein meets a fixed multiplier.
The second advantage is that a nitrogen test does not care about amino acid balance. We have already explained why collagen scores zero: it lacks tryptophan. What is less often discussed is what happens if a manufacturer adds the missing tryptophan.
Using the same published data, we calculated what collagen would score with tryptophan no longer limiting. On the adult reference pattern, the score rises from 0 to only about 33, held back by the sulphur amino acids, with histidine and leucine close behind. [5]
Adding the missing amino acid can make collagen technically complete. It does not make it comparable to whey.
PDCAAS AND DIAAS: WHAT THE SCORES ACTUALLY MEASURE
Both scores ask the same question: if this were your only protein source, how well would its digestible essential amino acids meet your requirements? [3]
Both work like a chain. They find the first-limiting amino acid, the essential amino acid in shortest supply relative to a reference pattern, and score the protein on that weakest link. [3]
The difference lies in how they get there.
|
|
PDCAAS |
DIAAS |
|---|---|---|
|
Introduced |
FAO/WHO, 1991 |
FAO recommended it to replace PDCAAS in 2013 |
|
Where digestibility is measured |
Across the whole digestive tract, using faeces, traditionally in rats |
At the end of the small intestine, with the pig as the preferred model |
|
How digestibility is applied |
One crude protein value for every amino acid |
A separate value for each essential amino acid |
|
Maximum score |
Capped at 100 (or 1.0) |
Not capped for single proteins |
The location matters because amino acids are absorbed in the small intestine, while bacteria in the large intestine can change what reaches the faeces. [4] An ileal measurement therefore gets closer to what the body actually absorbed.
The cap matters because it hides differences at the top of the scale. Once a protein reaches 100 on PDCAAS, any additional surplus of essential amino acids disappears from view. [4]
A 2024 review by researchers including the chair of the FAO consultation concluded that DIAAS is currently the most accurate score for routinely rating single-source proteins. [3]
THE LINK MOST PEOPLE MISS
Here is where the two halves of this article connect. DIAAS is calculated per gram of crude protein, and crude protein is nitrogen multiplied by 6.25. [3]
That means non-protein nitrogen affects the two numbers in opposite directions. It pushes the label figure up, but it pushes a properly calculated score down, because the same essential amino acids are now spread across more apparent protein.
The catch is the phrase “properly calculated”. A score only reveals this if it is calculated for the finished powder. A brand quoting a whey score on a blended or fortified product is describing an ingredient, not the product you are buying.
WHAT DIAAS CANNOT TELL YOU
DIAAS is the best single score available, but it has clear limits:
- It reports only the weakest link. A protein can lose a meaningful amount of leucine with little warning from the score, as we show below. [3]
- It depends on the reference pattern. The pattern is an estimate of requirements, and the same protein scores differently under different patterns. [3]
- It was designed for single foods. Scores cannot simply be added or averaged across a meal or a blend. The calculation has to go back to the digestible amino acids. [3]
-
It rates protein, not overall food quality. It should not be read as a verdict on the whole product. [3]
WHAT THE SCORES LOOK LIKE IN PRACTICE
A 2017 University of Illinois study scored eight proteins with both methods in the same animals, which makes it a useful side-by-side comparison. [4]
Swipe to see all columns.
| Protein source | PDCAAS, capped (1991 method) | DIAAS (age 6 months to 3 years) | DIAAS (older children, teens, adults) | First-limiting amino acid in DIAAS |
|---|---|---|---|---|
| Milk protein concentrate | 100 | 120 | 141 | Sulphur amino acids |
| Whey protein concentrate | 100 | 107 | 133 | Histidine |
| Whey protein isolate | 99 | 100 | 125 | Histidine |
| Skim milk powder | 100 | 105 | 123 | Sulphur amino acids |
| Soy flour | 98 | 89 | 105 | Sulphur amino acids |
| Soy protein isolate | 93 | 84 | 98 | Sulphur amino acids |
| Pea protein concentrate | 75 | 62 | 73 | Sulphur amino acids |
| Whole-grain wheat | 50 | 45 | 54 | Lysine |
Mathai et al., 2017. PDCAAS values are “PDCAAS-like”, determined in pigs rather than rats. The PDCAAS column uses the 1991 reference pattern, so it is not a like-for-like comparison with the DIAAS columns.
Look at whey concentrate and soy flour. Capped PDCAAS puts them almost level at 100 and 98. DIAAS, without the cap, separates them. [4]
Three cautions are needed before anyone turns this table into marketing.
A score belongs to a sample, not a category. A second experiment from the same laboratory scored a different whey protein isolate at 103 rather than 125 on the adult pattern, and at 82 on the younger pattern. Bovine collagen scored 0 on every pattern. [5] In our own comment, we said whey typically scores above 100. That holds for these samples on the adult pattern, but any score means little without its pattern and its source.
These are pig studies on raw ingredients. The growing pig is the accepted model, but the results are not human measurements, and the authors note that processing can change digestibility. [3,4] The 2017 study was also funded by a dairy organisation, which the authors state had no role in its design, analysis or writing. [4]
The quality bands are guidelines. The FAO suggested 100 and above as excellent, 75 to 99 as good, and no quality claim below 75, while recognising that these cut-offs were not based on documented research. [4]
A low score also does not make a plant protein useless. Different proteins have different limiting amino acids, so they can complement each other in a blend or across a day of eating. [3,4] The fair comparison is the finished blend, calculated from its digestible amino acids.
WHAT PADDING DOES TO A 25 G SCOOP
To see what this means in a real scoop, we modelled five hypothetical powders using the published amino acid and digestibility data for whey concentrate and bovine collagen. [4,5] All five would read 25 g of protein on a nitrogen test.
Swipe to see all columns.
| Hypothetical 25 g label claim | Whey protein | Digestible leucine | Digestible essential amino acids | Calculated DIAAS (adult pattern) |
|---|---|---|---|---|
| 100% whey | 25 g | 2.9 g | 13.7 g | 134 |
| Whey + collagen (20 g + 5 g of label protein) | 20 g | 2.5 g | 11.7 g | 115 |
| Whey + 4 g glycine | 20.3 g | 2.4 g | 11.2 g | 109 |
| Whey + 3 g creatine monohydrate | 19.7 g | 2.3 g | 10.8 g | 106 |
| Whey + collagen (15 g + 10 g of label protein) | 15 g | 2.0 g | 9.7 g | 96 |
Our calculations, for illustration only. These figures do not describe any specific product, including ours. Essential amino acids follow the scoring pattern, which counts cysteine and tyrosine with methionine and phenylalanine.
Same label. Up to about 30% less leucine and essential amino acids.
The table also shows something that may surprise you. With this high-scoring whey, the 20 g + 5 g blend still lands at 115, even though it has lost about 15% of its leucine. The score is tracking histidine, so the leucine loss does not appear in it. This is why a high DIAAS alone cannot prove that a formula is unchanged.
The starting whey matters too. Run the same four padded formulas with the lower-scoring whey isolate from the second experiment, and all of them fall below 100. [5]
WHAT EU LABELS DO AND DO NOT TELL YOU
EU rules give you useful information, but they were not designed to answer the question of protein quality.
- The protein figure follows the nitrogen formula. It does not state how much of the nitrogen came from intact protein. [1]
- The ingredient list is mandatory, which makes it your best starting point. [1]
- A “high protein” claim requires at least 20% of the energy to come from protein. [12] That is a test of quantity, so collagen can meet it despite scoring zero for quality.
- PDCAAS and DIAAS are not part of the protein definition or the “high protein” condition. [1,12]
- Tolerances exist because labels cannot be perfectly exact. European Commission guidance for food authorities sets ±8 g per 100 g for a protein declaration above 40 g per 100 g, and says declared values should reflect true averages rather than sit at either extreme. Stricter limits can apply where a claim is made. [13]
EU law also says food information, including advertising and presentation, must not mislead as to a food’s composition or quantity. [11] So using a legal formula does not by itself settle whether a product’s presentation is fair.
A label can follow the formula and still leave out what a customer most wants to know.
HOW TO CHECK A PROTEIN POWDER
You do not need a laboratory to ask better questions.
-
Read the ingredients before the protein number. Look for L-glycine, L-alanine, L-arginine, taurine, creatine, collagen, gelatine or any named amino blend. If they are present, ask whether the protein figure includes them.
- Ask for the finished product’s amino acid profile. A chart for pure whey cannot describe a blend. The markers below give you a rough reference.
- Ask what was tested beyond total nitrogen. Useful answers mention a bound amino acid profile, free amino acids and a screen for compounds such as creatine and taurine. [8,9]
- Question any quoted score. Was it measured on the finished product or the raw ingredient? Which reference pattern was used? Is it PDCAAS or DIAAS?
|
Per 100 g of crude protein |
Leucine |
Glycine |
|---|---|---|
|
Whey protein concentrate |
11.9 g |
2.1 g |
|
Whey protein isolate (two samples) |
11.3 to 11.6 g |
1.7 to 1.8 g |
|
Bovine collagen |
3.0 g |
22.2 g |
Our calculations from published analyses. [4,5] Individual ingredients vary, so treat these as rough markers, not pass or fail limits.
As a guide, a whey product showing far more glycine or far less leucine than this deserves a closer look. If a brand cannot answer these questions, that is useful information as well.
OUR POSITION AT ATHLETE FUEL
So, is 25 g of protein always 25 g of protein? As a measurement of nitrogen, yes. As a promise about what your body receives, no.
This question has become more important as whey prices have climbed. When a key raw material doubles (or more) in cost, the pressure to stretch it grows. We cannot know any individual brand’s intent, and a blend is not automatically dishonest when it is clearly explained. Customers simply deserve to know what has changed.
For THRIVE, the ingredient list is short: whey protein concentrate, natural flavours, 95% Reb-M stevia extract and sunflower lecithin. It contains no free amino acids, no milk protein, no collagen and no creatine.
PROTEIN QUALITY AND NITROGEN SPIKING: FREQUENTLY ASKED QUESTIONS (TLDR)
What is the difference between PDCAAS and DIAAS?
Both score a protein on its first-limiting essential amino acid. PDCAAS uses one whole-tract crude protein digestibility value and caps the score at 100. DIAAS uses a separate ileal digestibility value for each essential amino acid and is not capped for single proteins. [3,4]
Is a higher DIAAS always better?
Not on its own. Above 100, a protein supplies more than the reference pattern on its limiting amino acid, but the score does not show differences in leucine or other amino acids. Compare scores only when they use the same reference pattern. [3]
Does whey always score above 100 on DIAAS?
No. Published whey samples scored above 100 on the adult pattern, but scores vary by sample and pattern. One whey protein isolate scored 82 on the pattern for children aged 6 months to 3 years. [4,5]
Is creatine in a protein powder always spiking?
No. Creatine can be a legitimate addition. It becomes a problem when its nitrogen is counted within the protein figure, because creatine is not protein. [7,8]
Can spiking be detected from the nutrition table?
Not from the protein figure alone, because the standard calculation counts total nitrogen. Laboratories need to compare it with bound and free amino acids and screen for non-protein nitrogen. [8]
Can a whey and collagen blend still score above 100?
Yes, in some cases. Using one high-scoring whey concentrate, we calculated a score of 115 for a blend with 20% of its protein from collagen. That same blend still supplied about 15% less leucine than pure whey, and a lower-scoring whey would give a very different result. [4,5]
REFERENCES
- Regulation (EU) No 1169/2011 on the provision of food information to consumers. Annex I, point 10, and Article 9. Read the regulation.
- Mariotti F, Tomé D, Mirand PP. Converting Nitrogen into Protein: Beyond 6.25 and Jones’ Factors. Critical Reviews in Food Science and Nutrition. 2008;48(2):177–184. Read the review.
- Moughan PJ, Lim WXJ. Digestible indispensable amino acid score (DIAAS): 10 years on. Frontiers in Nutrition. 2024;11:1389719. Read the review.
- Mathai JK, Liu Y, Stein HH. Values for digestible indispensable amino acid scores (DIAAS) for some dairy and plant proteins may better describe protein quality than values calculated using the concept for protein digestibility-corrected amino acid scores (PDCAAS). British Journal of Nutrition. 2017;117(4):490–499. Read the study.
- Mathai JK. Digestible indispensable amino acid scores for food proteins. Doctoral dissertation, University of Illinois at Urbana-Champaign. 2018. Read the dissertation.
- Vegconomist. Food-Specific Protein Factors Lower Calculated Protein by up to 20%, New Database Finds. 18 September 2026. Read the report. Original paper in Food Chemistry.
- Natural Products Insider. Is your protein product spiked? No whey and Reduce protein spiking with the right tests.
- BSCG. Amino Spiking: How Protein Powder Brands Verify Protein Claims and Investigate Concerns. 2026. Read the article.
- NutraIngredients. Informed Protein aims to boost transparency and confidence in protein products. 26 January 2023. Read the article.
- Volpi E et al. Essential amino acids are primarily responsible for the amino acid stimulation of muscle protein anabolism in healthy elderly adults. American Journal of Clinical Nutrition. 2003;78(2):250–258. Read the study.
- European Commission. Fair Information Practices. Read the page.
- Regulation (EC) No 1924/2006 on nutrition and health claims made on foods. Annex. Read the regulation.
- European Commission. Guidance document for competent authorities on the setting of tolerances for nutrient values declared on a label. December 2012. Read the guidance.



0 Comments
There are no comments for this article. Be the first one to leave a message!